Student Projects
VE/VM450

Deep Learning for Anomaly Detection
Sponsor: DataPipeline
Team Members: Boying Zhu, Yinghui Hong, Yan Zhan, Shuheng Liu, Youchen Zhao
Instructor: Prof. Chong Han
Project Video
Team Members

Team Members:
Boying Zhu
Yinghui Hong
Yan Zhan
Shuheng Liu
Youchen Zhao
Instructor:
Prof. Chong Han
Project Description
Problem Statement
Today, with the growing of the internet, we can easily get large amounts of data from e-commerce platforms, online sensors, social media. We need to detect the abnormal data point, like finding cheating behavior for online shipping sites, some retailers may use the clicking farming and fake review to increase their rate unfairly, which would surely harm the users’ experience and should be detected and removed.
However, The great number of data makes it impossible for humans to review all of them. so we are going to design the system that can automatically detect the Abnormal data for stream data.
Concept Generation
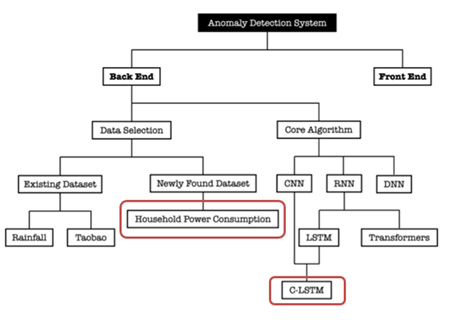
The anomaly detection system are composed of two parts: the front-end part and the back-end part. For the front end, the aim is to show the warning message when an anomaly occurs. For user convenience, the web page should show all existing outlier. For the back end, two aspects should be considered: the selection of data set and the choice of deep learning model. The chosen data set will affect our decision of the deep learning model.
Finally, We choose the household power consumption [1] and the IBM stock price [2]. Correspondingly, the C-LSTM model[3] is chosen.

Fig. 1 Concept Generation
Design Description
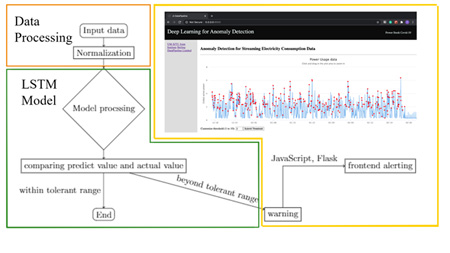
In the project, there are mainly three parts, the input data re-sampling and prepossessing, LSTM training models and the front-end alerting systems.

Fig.2 The whole set-up system
Modeling and Analysis
Back-End: Long short-term memory (LSTM) is a special recurrent neural network (RNN) architecture. It trains the proper weight matrix which best fits for long sequential data, and looks at the previous values to predict the behavior. Based on the predict value, if the actual value is within the tolerant range, (i.e., two standard deviations ), it is considered as normal, else an altering message would be sent.
Front-End: The front-end design is separated into two parts:
the representational state transfer application programming interface (REST API) and the user interface.
![Fig. 3 C-LSTM Model Structure[3]](https://www.ji.sjtu.edu.cn/wp-content/uploads/2020/08/450-22-pic03.jpg)
Fig. 3 C-LSTM Model Structure[3]

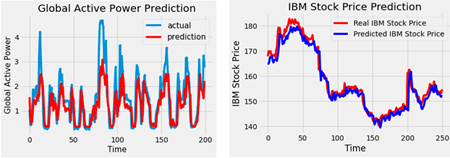
Fig. 4 Trained Result for Household Power Consumption and IBM Stock Price
Validation
Validation Process:
For alert system, a timer was set to test the necessary time from stream data inputted to a warning email sent.
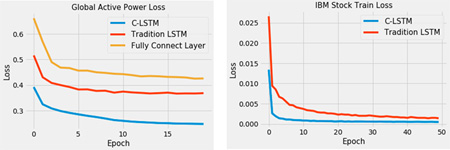
For the C-LSTM model, MSE was used to compare with the baseline.
Validation Results:
According to validation part, most specifications can be met.
√ MSE<= 80% of the baseline
√ Time for warning e-mail<= 1s
√ Cost<=1000 RMB
√ means having been verified and · means to be determined.

Fig.5 The MSE compared with the baseline
Conclusion
A C-LSTM model which takes in time-series data to train and detects anomaly is . Also, a user-friendly front-end is designed to visualize the data and show the anomaly.
After combining the model and the front-end, an anomaly detection system is developed. It can deal with:
1. Stream data input;
2. Automatic monitor for outliers;
3. Real-time alert system by email.
Acknowledgement
Sponsor: Su Chen, Rui Wang from Beijing Datapipeline Limit
Instructor: Prof. Chong Han from UM-SJTU Joint Institute
Reference
[1] https://www.kaggle.com/uciml/electric-power-consumption-data-set
[2] https://www.kaggle.com/szrlee/stock-time-series-20050101-to-20171231
[3] Tae-Young Kim, Sung-Bae Cho, Web traffic anomaly detection using C-LSTM neural networks
