Student Projects
VM495

Different Performances of Wind Paths on Chip Cooling Process
Team Members: Buyao Lyu, Fengyu Zhu, Jiacheng Zhou, Kexin Weng, and Linkai Xue
Project Video
Team Members
Team Members:
Buyao Lyu, Fengyu Zhu, Jiacheng Zhou, Kexin Weng, and Linkai Xue
Project Description
Introduction
In the field of computer chips, inefficient heat dissipation of CPU impedes the development of computational capacity. This experiment tests the cooling effect between different wind-path designs in a standard ATX size PC chassis, and constructs a simplified convective heat exchange model to help explain the results. The objective of this experiment is to find out the optimized wind path design and try to give reasonable explanation on it.
Equipment & Experiment Set Up
Fig. 1 shows the experimental equipment, it contains two main parts: the chassis and the fins connected to CPU. The whole fin-structure is settled inside the chassis. On the surface of the chassis there are 3 openings, and 5 fans are assembled at the openings, respectively. As each surface can act as an inlet or an outlet, we have totally 2 x 2 x 2 -2 = 6 different wind paths, as shown in Fig. 2. To reach steady state we run AIDA64 FPU stress test and Furmark GPU stress test simultaneously for 15 minutes, and collect data until there is no isotherm change from infrared camera. Each of 6 wind paths is turned on and the steady state temperature distribution of CPU is measured using built-in sensors. Our objective is to measure different wind path’s performance and find out the optimized one.
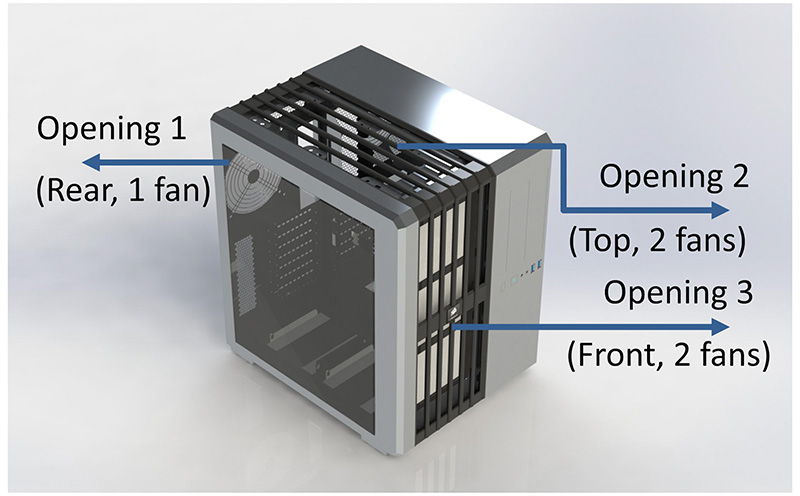
Fig.1 Modern Structure of an ATX PC Chassis
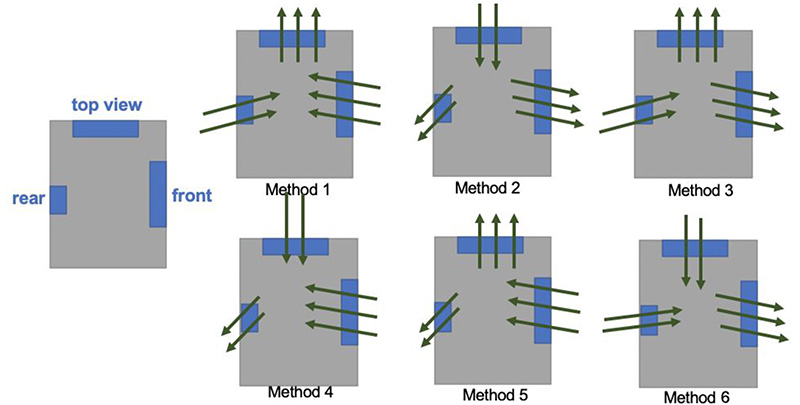
Fig.2 Six Wind Path Designs
Experiment Results
We collect data from monitoring software HWMonitor and the monitoring positions are from CPU, GPU and Motherboard.
Using MATLAB we transferred gray-scale diagram into colored diagrams from which we can have a better view of thermal distribution inside the chassis where better evaluation and validation of general feature of convective heat transfer can be made.
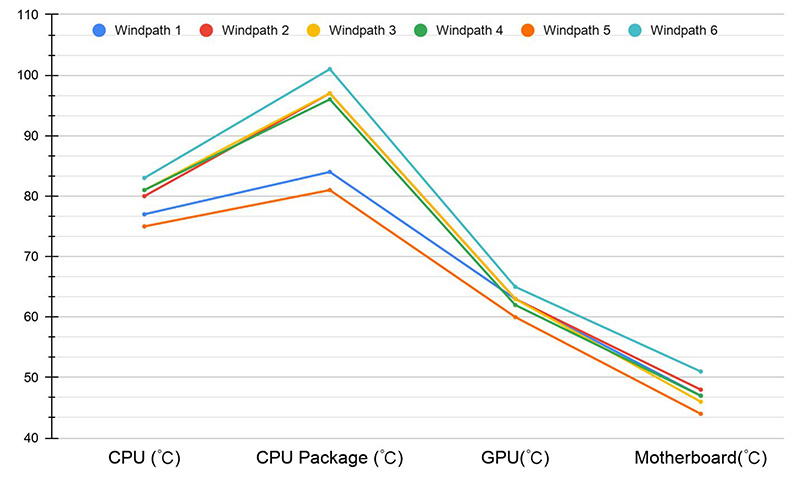
Fig.3 Temperature Data for all 6 Flow Patterns
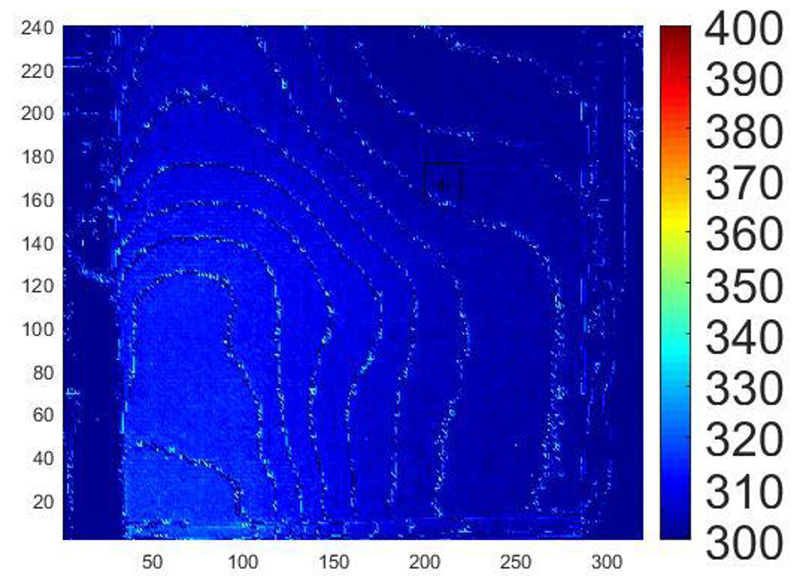
Fig.4 Calibrated Infrared Picture
Modeling Analysis & Discussion
To better understand cooling pattern of different wind paths and avoid unnecessarily complicated computation process, a simplified cooling model (only 4 fin structures involved) is built up by COMSOL Multiphysics 5.4. Fig 5 shows the overview of the model.
Finite Element Method (FEM) is utilized to solve the coupling of heat field and flow field. Fig 6 gives the expected outcome of temperature distribution on CPU/chip after griding and computation.
The same process is conducted for 6 wind paths and temperature differences are analyzed among different cooling patterns.
Simulation results for the modeling of the wind paths are displayed in Fig. 7, the box plot shows the CPU’s temperature range respectively, and design of wind path 5 has the lowest temperature, indicating the most favorable cooling effect; while wind path design 6 has the highest temperature range, indicating the least favorable cooling effect. In comparison, the simulation results are highly consistent with physical measurements as shown in Fig.3, and we can draw the conclusion that the simulation interprets the experiment successfully.
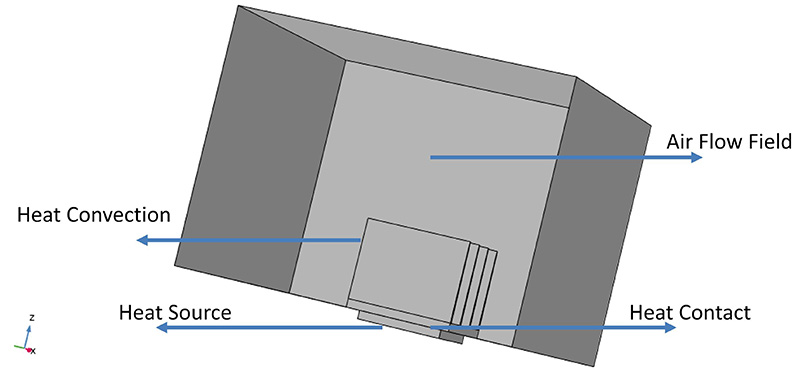
Fig.5 Physical Fields involved in Model

Fig.6 Expected Simulation Results
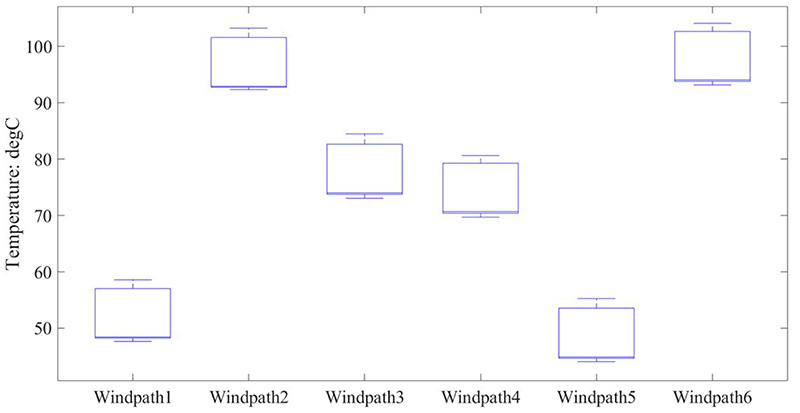
Fig.7 Simulation Results Comparison
Conclusion
From the experiment result, we can compare a total number of 6 wind-path designs. Figure 3 shows that the fifth wind-path has the greatest efficiency and lower temperature. From our thermal simulation, as we can see from the Fig.7, method 5 also has the lowest CPU temperature, which is align with our experimental result. Besides, as we predicted before the experiment, method one also has relatively high cooling efficiency due to smaller density of hot air. So we can conclude that our experiment align well with our simulation and prediction and method 5 has the greatest cooling efficiency among 6 wind patterns.
