Student Projects
VE/VM450

Motor Condition Monitoring Based on Machine Learning
Sponsor: Zhen Wei (Rockwell Automation)
Team Members: Yunzhe Jiang, Wanzhen Liu, Yiwen Qian, Yumeng Shao, Ren Wang
Instructor: Prof. Chengbin Ma
Project Video
Team Members

Team Members:
Yunzhe Jiang
Wanzhen Liu
Yiwen Qian
Yumeng Shao
Ren Wang
Instructor:
Prof. Chengbin Ma
Project Description
Problem Statement
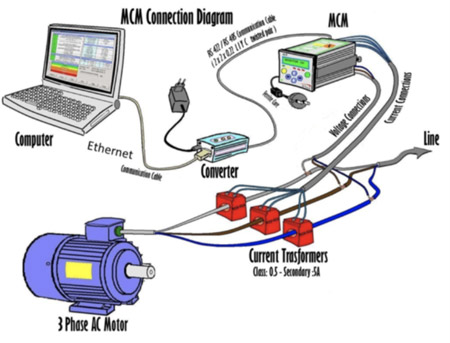
The traditional detection of electrical motor fault mainly depends on monitoring data from the vibration sensor. However, it needs much extra work to place and secure the vibration sensor on the motor. So we need a non vibration-based method to identify motor faults with high
accuracy.

Fig. 1 Motor fault detection system
Concept Generation
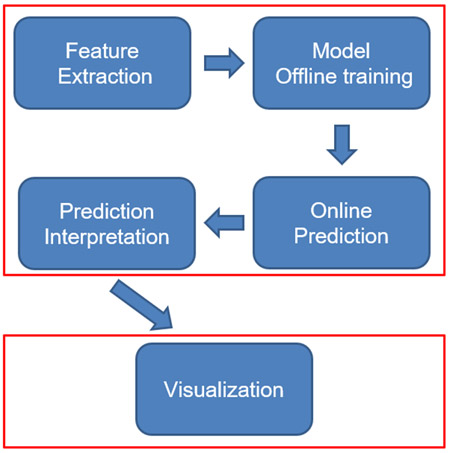
Our system is divided into two sub-system: machine learning sub-system and visualization sub-system. The machine learning sub-system contains four components which are feature extraction, model training, prediction and interpretation. The visualization sub-system present a web interface with trained model embedded in the
back-end.

Fig. 2 Design procedure
Design Description
Feature extraction:
From each current signal, we extract 10 time-domain features and 12 frequency-domain features so for three-phase current signals 𝐼_𝑎,𝐼_𝑏,𝐼_𝑐 we have totally 66 features. Plus a categorical feature “mode type”, we have 67 features in all.
Model training:
We choose LightGBM[1] as our model where its inputs are 67-dimension vectors and output is one of the four labels: Outer8mm, Outer3mm,
Inner8mm, Normal.
Prediction:
The trained model makes predictions on feature extracted from new data.
Interpretation:
We apply TreeSHAP to interpret predictions in terms of feature
importance.
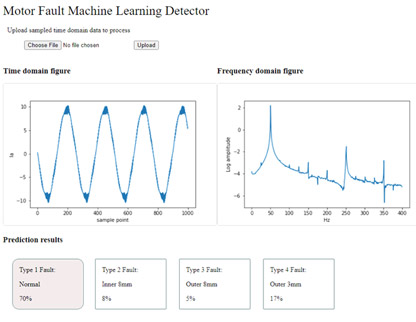
Visualization system:
We will deploy our machine learning system, as well as the web visualization interface on a PC. The web server will be hosted by Python Web Framework Flask. The figures on the web page are generated using
Matplotlib library.

Fig. 3 The visualization system
Validation
Validation Process:
Our design has been validated to fulfill all customer requirements. We validate on accuracy which tells our model’s satisfying performance. Validation on training and predicting time indicates our model’s high efficiency. Other specifications are met as well.
Validation Results:
| Item | Specification | Performance |
|---|---|---|
| Accuracy | Over 90% | 96.5% |
| Training time | ≤ 10 sec | 0.83 sec |
| Predicting time | ≤ 0.01 sec | 0.00055 sec |
| # of Fault type | 3 | 3 |
| Signal Source | No vibration | No vibration |
Table. 1 Engineering specification ch
Conclusion
In our design, we apply the method of machine learning to classify the motor fault conditions, and thus our customer can be freed from installing vibration sensors when diagnosing motor fault. The selected design is mainly composed of five components: feature extraction, model training, prediction, model interpretation and
visualization system.
Acknowledgement
Zhen Wei, Lei Jing, Benfeng Tang from
Rockwell Automation
Prof. Chengbin Ma, Prof. Chong Han
from SJTU Global College
Reference
[1] Ke, Guolin, et al. “Lightgbm: A highly efficient gradient boosting decision tree.” Advances in neural information processing systems. 2017.
